


Cyclocross Nationals is the annual reunion of the U.S. cyclocross community, and although it is not the be-all and end-all of participation in the United States, it can be a gauge of participation levels and overall health of the sport.
Each year when we attend Nationals, it is hard to not look around at the scene and field sizes and try to divine conclusions about overall participation. This year at Louisville Nationals, I was alternately told that participation looked to be among the highest ever and that this was the newer, smaller Nationals we should get used to after the cyclocross boom.
Overall, cyclocross participation in the U.S. has plateaued since 2012 after years of growth. Anecdatally, a marginally in-depth analysis of participation in some Midwest cyclocross scenes I did reflects the observed plateau as well.
With national cyclocross participation at a peak, has Nationals participation peaked as well? I decided to go to the numbers for a look at Nationals participation for the past decade-plus and see if Louisville was big, small or somewhere in between.

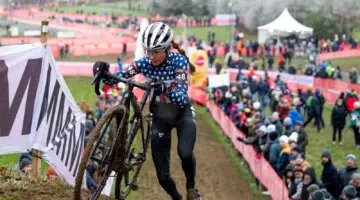
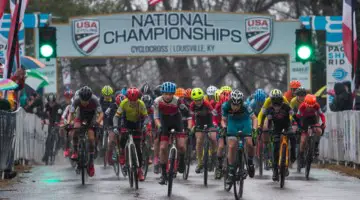
How did Louisville Nationals stack up in terms of participation? We went to the numbers. Elite Women. 2018 Cyclocross National Championships, Louisville, KY. © A. Yee / Cyclocross Magazine
Methodology
First a little bit about how I did it—it is tough to escape showing my work after almost a decade in grad school, after all. As with all things results related, many thanks are due to crossresults.com for the completeness of its database and easy-to-use data formatting.
Crossresults has results for every day of Nationals dating back to the December 2006 event in Providence, Rhode Island.
A quick and dirty way to gauge participation is to go to “Results” –> “View All Races” and simply tally the total number of racers across each day of Nationals. That approach is a quick and easy way to do it, but obviously, a lot of racers double up at Nationals—age group and singlespeed, Collegiate and UCI, championship and non-championship—so those numbers do not reflect the total number of individual participants.
One thing of note is Nationals have gotten longer over the years, with the event taking place over four days, then five and now six. However, the races have still gone by 5-year age group increments for Masters and 2-year increments for Juniors, so the same races have been offered, just over different periods of time.
Crossresults lists both a rider’s USAC ID and a Crossresults ID. Sorting results by either of those numbers makes it easy to find individual riders. Obviously, the method is not perfect, but this is not a peer-reviewed paper (I hope?), so it should be good enough.
I also broke the numbers out by non-championship events and women and men participants in the Junior (U17) races. As far as we can tell, the Asheville donut race results are not included in this analysis.
Tables for participation by year are at the bottom of this post, if you are more into numbers than pictures.
Nationals Participation, by Year
So how did Louisville Nationals stack up? Pretty well, it turns out.
Based on number of participants, Louisville was the third most-attended Nationals in the last 13 years, with 1,548 total participants. Only 2015 Austin and 2016 Asheville had more total participants, with Asheville pulling in 1,650.
Total participation in recent years has, on average, been higher than the late 2000s, and we could, in theory, fit a trendline to show that participation has been growing. An R² of 0.3 (a measure of how well the trend line fits the data) is pretty low and there is a lot of variance in numbers from the past say, six years, so a deeper look into the numbers is likely warranted.

Cyclocross Nationals Participation Trend, 2006 to 2018
A closer look shows that as in real estate, Nationals location matters. The 2009 and 2010 Bend Nationals had impressive participation relative to locations prior and future, with an average of 1,350 racers per year. With the Cyclocross Crusade series in that area, it is not a surprise that Nationals participation was so high at those races.
The sad spot, especially for me, is Madison/Verona Nationals in January 2012 and 2013. Those two events had the lowest participation of all Nationals, with an average of 920 racers per year.
I live in Madison, it is currently January and I would not want to race cyclocross here right now either. I really hope that is the explanation for folks not coming to my hometown!
Madison appeared to be a blip, as Boulder was number six and then Austin and Asheville were two and one, respectively. The East Coast Hartford Nationals in 2017 did really well, checking in at the fourth-highest participation number.
I may be off base here, but I vaguely remember grumblings that Hartford was not a chic city like Boulder, Austin and Asheville. If that was truly the case, it is further evidence that a location near large populations of cyclocross racers drives Nationals participation.

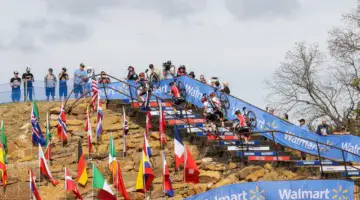
Hartford Nationals had strong participation, even despite the mercurial weather. 2017 Cyclocross National Championships, Elite Men. © A. Yee / Cyclocross Magazine
Women’s Participation
One thing that is especially clear is women’s participation has grown over the last decade.
A total of 403 women raced in Louisville, which was second to Asheville for tops in the last 13 years and over double the number who raced in Providence and Kansas City in the late 2000s. Overall, women’s participation has grown to 26 percent of total participants during the last two cyclocross Nationals.
Hopefully, both USAC and local scenes will continue to provide opportunities for women’s ’cross and that 26 percent will become higher in the future.

Women’s Participation at Nationals, 2006 to 2018
Junior Participation
Another clear bright spot from the participation data is the growth in Juniors racing at Nationals. For various reasons, Juniors are defined here as riders in the U11 championship/non-championship and 11-12, 13-14 and 15-16 championship categories.
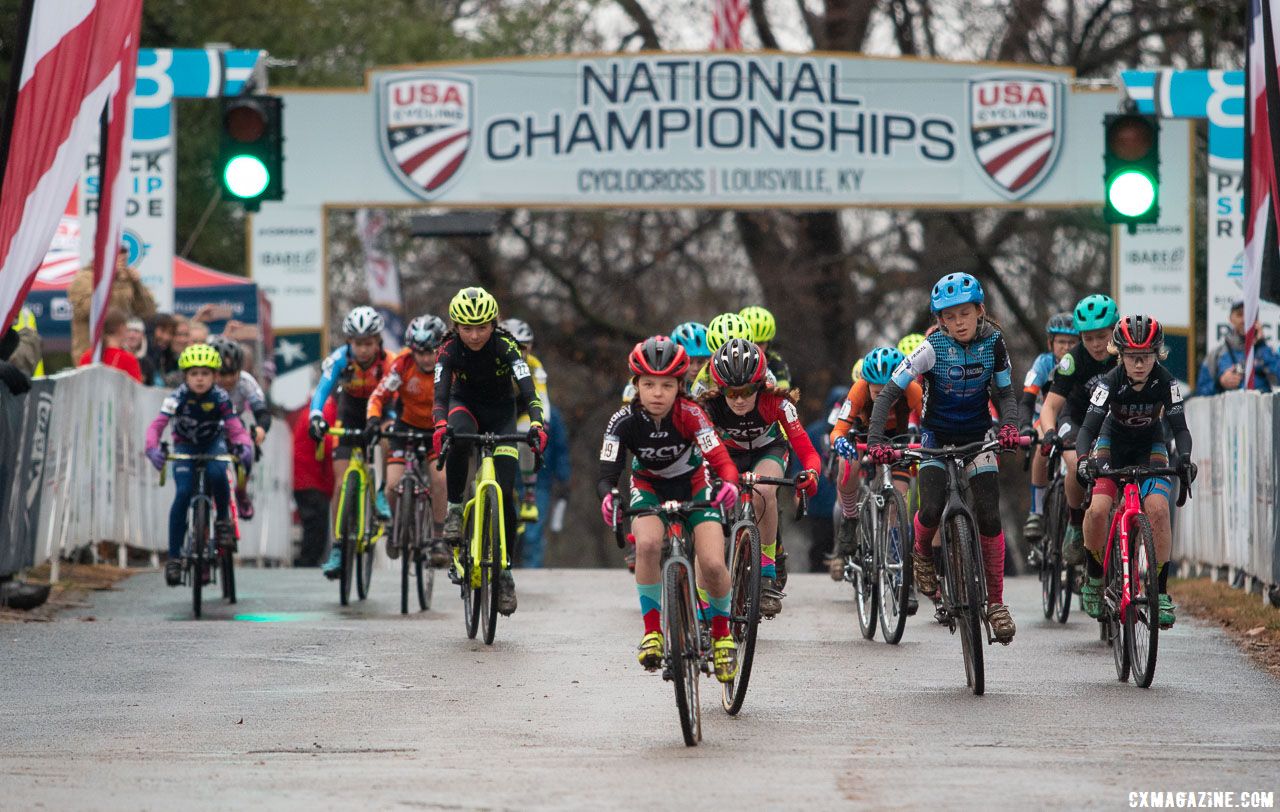
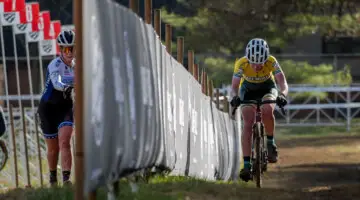
Louisville Nationals had the second-highest Junior participation ever. Junior Women 11-12. 2018 Cyclocross National Championships, Louisville, KY. © A. Yee / Cyclocross Magazine
Louisville Nationals was the best year yet for Junior participation, with 329 young women and men toeing the muddy start line at Joe Creason Park. No doubt that number reflects the impressive Junior programs in the OVCX, but it also fits with a clear trend of growth over the years.
I am much more willing to put a trend line on this one.

Junior Participation at Nationals, 2006 to 2018
Louisville Nationals was also a banner year for Junior women, with over 100 taking the start line. For perspective, just 18 Junior women raced at Providence Nationals in 2006. This year, Junior women made up over 30 percent of the total number of Junior participants.
From both the perspective of talent development and the overall health of cyclocross in the U.S., the growth in participation among Juniors is a bright spot in an overall picture that is probably much grayer.

Juniors, especially women, are a bright spot for U.S. ‘cross. Junior Women 13-14. 2018 Cyclocross National Championships, Louisville, KY. © A. Yee / Cyclocross Magazine
One question that struck me after looking at the Junior data was, with the growing popularity of Junior participation at Nationals, are the positive numbers observed in recent years the result of increased Junior participation alone?
Based on this premise, subtracting out the Junior racers still shows that Louisville’s over-17 participation was fourth-highest all-time, slipping just below 2009 Bend.
Overall, the takeaway appears to be participation in Louisville was strong at all ages.

Nationals Participation – Junior, 17+ and total, 2006 to 2018
Non-Championship Participation
One thing that caught my attention when going through the participation totals was the large number of riders who raced non-championship races in Austin and Asheville and to a lesser extent, Hartford. Non-championship races provide a chance for locals to try the course, support staff to get a race in or even top-level riders to get one last race-pace training session in before their big races.
Based on the data linked above from Colin Reuter, one could argue that the mid-2010s were the peak of the “cyclocross boom” when the sport was especially popular among more casual participants. In light of that and the strength of the ’cross scenes in Texas, North Carolina and New England, perhaps the increased non-championship participation makes sense.
Generally speaking, participation in the non-championship races follows the overall Nationals participation. I admittedly did not separate out how many riders only raced in the non-championship race, so it is a bit tough to discern if non-champ participation drives overall numbers or if non-champ racers reflect the overall popularity of a given Nationals.

Non-Championship Participation Versus Overall, 2006 to 2018
What Does it All Mean?
Good question.
First off, from a participation standpoint, Louisville Nationals did quite well, especially given the plateau in overall cyclocross participation (based on Reuter’s findings).
Overall participation numbers were high, and historically high numbers of women, Junior women and Juniors raced in Louisville.
Looking at numbers across the years, that data suggest that location matters if you are looking to maximize Nationals participation. Based on data from the last 13 years, one could argue holding Nationals in the OVCX region, New England or Oregon is the best way to get folks out to race.
Have thoughts of your own? Let us know. I did the best I could with the available data, but as is always the case, our readers have experience and knowledge that extend far beyond what we could ever hope to have.
Nationals Participation by Year, 2006 to 2018
| Year | Women | Men | Total |
|---|---|---|---|
| Dec 2006 | 191 | 975 | 1166 |
| Dec 2007 | 200 | 812 | 1012 |
| Dec 2008 | 120 | 953 | 1073 |
| Dec 2009 | 312 | 1092 | 1404 |
| Dec 2010 | 315 | 981 | 1296 |
| Jan 2012 | 191 | 675 | 866 |
| Jan 2013 | 239 | 738 | 977 |
| Jan 2014 | 312 | 1053 | 1365 |
| Jan 2015 | 399 | 1200 | 1599 |
| Jan 2016 | 416 | 1231 | 1647 |
| Jan 2017 | 316 | 1147 | 1463 |
| Jan 2018 | 315 | 858 | 1173 |
| Dec 2018 | 403 | 1145 | 1548 |
Junior Nationals Participation by Year, 2006 to 2018
| Year | Women | Men | Total |
|---|---|---|---|
| Dec 2006 | 18 | 80 | 98 |
| Dec 2007 | 19 | 80 | 99 |
| Dec 2008 | 33 | 77 | 110 |
| Dec 2009 | 32 | 109 | 141 |
| Dec 2010 | 36 | 99 | 135 |
| Jan 2012 | 37 | 105 | 142 |
| Jan 2013 | 49 | 119 | 168 |
| Jan 2014 | 69 | 172 | 241 |
| Jan 2015 | 70 | 180 | 250 |
| Jan 2016 | 97 | 223 | 320 |
| Jan 2017 | 64 | 202 | 266 |
| Jan 2018 | 61 | 158 | 219 |
| Dec 2018 | 102 | 227 | 329 |
Non-Championship Race Participants
| Year | Non-Champ |
|---|---|
| Dec 2006 | 363 |
| Dec 2007 | 214 |
| Dec 2008 | 256 |
| Dec 2009 | 313 |
| Dec 2010 | 155 |
| Jan 2012 | 138 |
| Jan 2013 | 132 |
| Jan 2014 | 333 |
| Jan 2015 | 431 |
| Jan 2016 | 555 |
| Jan 2017 | 395 |
| Jan 2018 | 337 |
| Dec 2018 | 352 |